 The performance of the market over the last few days has heightened many people’s anxiety about whether the stock market is due for a major correction. For many, the memory of 2008/2009 lingers. No one can really predict if and when a major correction will occur, but anyone invested for the long term, who has a well-diversified portfolio with low fees, should be fine. In this blog I will walk through how I think about stock market risk and returns.
It is important to understand the difference between volatility and risk as applies to the stock market. The stock market is volatile, particularly in the short run. Risk, as it relates to your investment in the stock market, implies a chance that you would lose a significant portion of your investment. But over the long term the stock market has not been risky for those who have held a diversified portfolio for a sufficiently long period of time. The worst 20-year performance for the S&P 500 going back to 1871 was from 1901 to 1921, when the market was up 4.0%. In no 20-year period since 1871 would you have lost money. The average return for the S&P over from 1871 to 2014 is 8.6%, assuming dividends are reinvested. The 10-year return for the S&P, which includes the market meltdown of 2008/2009, is 7.4% and the 20- year return is 8.6%.
What a stock in a company represents is capital provided for corporate executives to use to build factories, invest in computer systems, open stores, hire people, etc. The executives evaluate all possible uses for that capital and pick the investments they think will generate the highest returns. A portion of the cash generated by the business based on those cumulative investments will then be given back to the stockholders in the form of dividends. Collectively, the performance of corporate executives deploying stock market capital has been fairly consistent over a very long period of time of time, and I see no reason why that would change.
Of course, an investor will not earn a smooth 8% every year, which is where the volatility comes in. Institutional investors who control billions in invested assets are not being paid to simply park their money in diversified index funds and wait 10 or 20 years for the 8% return that corporate performance dictates. They are evaluated based on short-term results compared to their peers and are under tremendous pressure to outperform. This results in significant volumes of trading and volatility within the stock market as these investment managers react (and often overreact) to any new information, both positive and negative. They are also reacting to changes in market sentiment, racing to be the first ones out of a down market and into an up market, which exaggerates swings in the market.
Annual returns for the broader stock market over the last 20 years ranged from a high of +33% in 2013 to a low of -37% in 2008. But if you add bonds (particularly Treasury bonds) to a portfolio of stocks, you can dramatically reduce that volatility. The reason is that when there is fear in the stock market and institutional investors want out, the alternative is often to park the money in Treasury bonds. In 2008 for example, an intermediate Treasury bond index fund would have been up 16% to help offset the 37% decline in the stock market. In academic terms, these assets are “negatively correlated.”
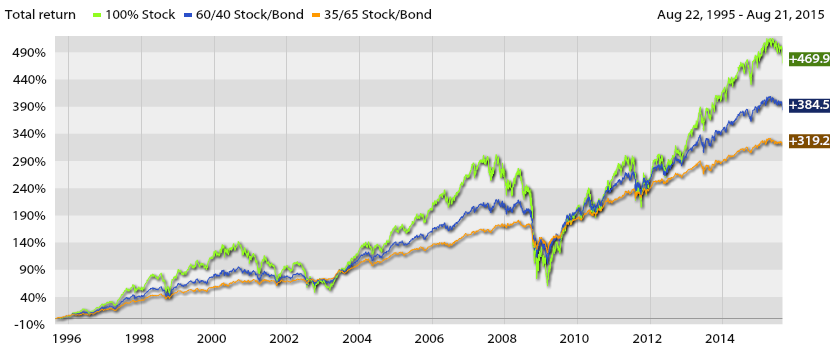
The chart below shows the 20-year return of three hypothetical portfolios built using index funds. The green line with the most volatility is a diversified portfolio of large and small cap domestic stocks, international stocks, and REITS. This 100% stock portfolio had a 20-year annualized return of 9.1%. The blue line (a typical portfolio I might recommend for someone later in the asset accumulation phase) is 60% stocks and 40% Treasury bonds. This portfolio had an annualized return of 8.2% with noticeably less volatility. The third line is a 35% stock and 65% Treasury bond portfolio that I might recommend for a retiree who cannot afford to take a big hit in the stock market since they are drawing on the portfolio. The 20-year annualized return would have been 7.4% and the ride would have been relatively smooth compared to the two other portfolios. The worst single year for that portfolio would have been – 9% in 2008.
The future return projections I use when modeling client retirement portfolios are more conservative when compared historical performance. A 60/40 portfolio might have a projected return in the 6.5% range and a 35/65 portfolio in the 5.0% range. This is due to lower inflation expectations and lower projected returns for bonds going forward.
I realize that market drop-offs like the one we are experiencing can be unnerving. But if you put it into historical context you’ll see that market corrections are very common and (at least in the past) the stock market always recovers and ultimately delivers returns that reflect long-term corporate performance.
Feel free to reach out if you have any questions.

